FEBRUARY REMAINED A CHALLENGING MONTH FOR SALES IN TOWNS AND CITIES, HOWEVER, INCREASES IN ATV IN THREE OF THE FIVE KEY SECTORS DEMONSTRATES SOME RESILIENCE.
According to Diane Wehrle, of Rendle Intelligence and Insights & Beauclair’s Brand Ambassador.
February remained a challenging month for sales in town and cities, with an annual decline of -5.4% from February 2024. The drop is likely to be slightly exaggerated due to an additional day in February last year, however, it is in sharp contrast to the annual increase in sales of +2.4% in February 2024.
Examination of each of the three sales metrics of transactions, customers and average transaction value provides valuable insight into the key drivers of the overall sales performance. Both transactions and customers declined annually in February (an -8.1% drop in transactions and a -6.7% drop in customers who purchased), while the average transaction value rose by +2.9% from February 2024. This contrasts with February 2024, when both transactions and customers rose annually (by +2.2% and +1.7% respectively) alongside an ATV that also rose from February 2023, albeit marginally (+0.2%).
The result for February is significant as it is reinforcing a definite shift in consumer behaviour that has been evident from mid last year. It indicates that the trend for fewer customers spending during their visits to towns and cities – which has been the case in every month since June 2024 – continued in February. In contrast, the increase in the ATV in February (+2.9%) continues the trend recorded in six of the past nine months since June 2024, indicating that those who did purchase were buying higher value items.
Five sectors account for 85% of total sales in towns and cities (Fashion, Food & Drink, General Retail, Grocery, and Health & Beauty), and sales declined annually during February in all five. The largest declines occurred in Fashion (-7.4%) and Grocery (-6.4%) which were the two sectors of the five which recorded declines in their ATV (-1.1% and -1.5%). The ATV in the other three sectors increased (by +3.3% in Food & Drink, by +4.7% in General Retail and by +3% in Health & Beauty) which helped to support their overall sales. The most modest decline in sales occurred in General Retail (-2.9%), which was a result of a combination of the smallest decline in customer numbers of the five key sectors (-3.7%) and the largest increase in ATV (+4.7%).
Virtually 50% of all town centre sales are accounted for by sales in the Fashion and Food & Drink sectors (24% and 25% respectively). The results for February could be regarded as a weathervane for the relative significance of these two sectors moving forward; customers in both sectors declined in February, but there was a smaller drop in Food & Drink customers than Fashion customers (-4.9% in Fashion and -3.5% in Food & Drink). Alongside this there was a greater drop in transaction numbers in Food & Drink than in Fashion (-8.2% versus -6.4%), however, the key differentiator was in the ATV which rose by +3.3% in Food & Drink but declined by -1.1% in Fashion. This is suggesting that whilst there are fewer hospitality customers making fewer transactions, the price point of those who do spend on Food & Drink is increasing whilst it is decreasing in Fashion.
On the basis that the past is the best indicator of the future, this suggests the significance of Food & Drink spending relative to Fashion spending in town centres is likely to increase further in 2025. This reflects a need for town centres to continue to embrace a greater diversity of offer and to drive up spending of those who continue to purchase.
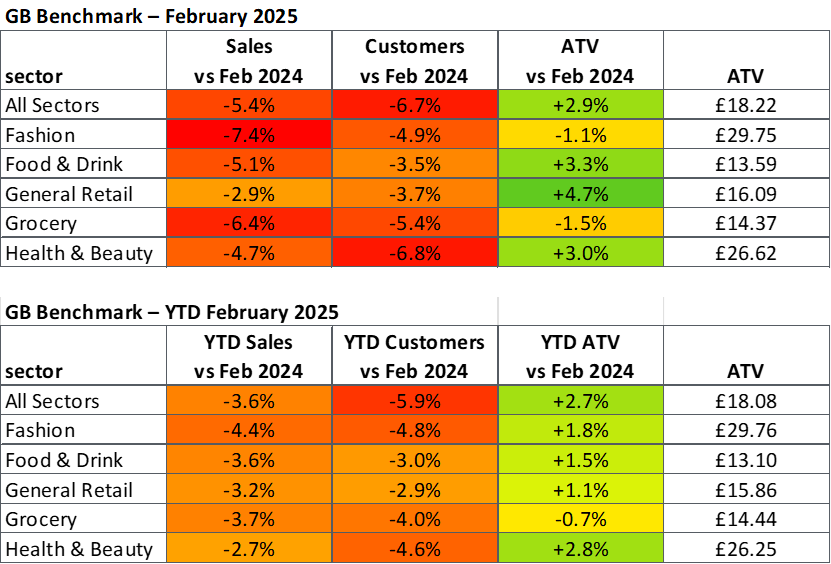
The table above shows the average performance of a 62 towns and city centres, across a range of key Retail Spend metrics.